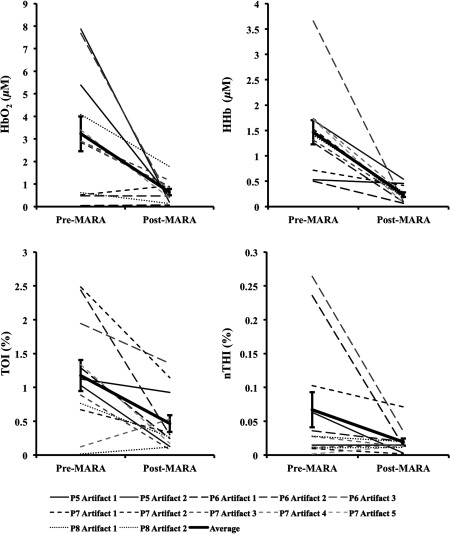
Fig. 6.
Difference between 10-s windows of data obtained before and after identified artifacts compared before and after the application of MARA (-axis). Values represent the absolute value of the difference between the amplitude of the data directly before and after an artifact. Error bars represent standard error of the mean.

