
Fig. 9.
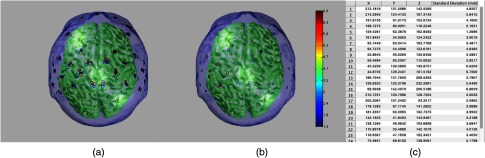
Running the intersubject variability analysis produces the two figures and table above: (a) shows the various probe optode positions color-coded by subject, (b) represents the standard deviation in millimeters, plotted at the mean of the optode positions, and (c) outputs the data presented in the previous two panels as a table that can be copied to the operating system’s clipboard.