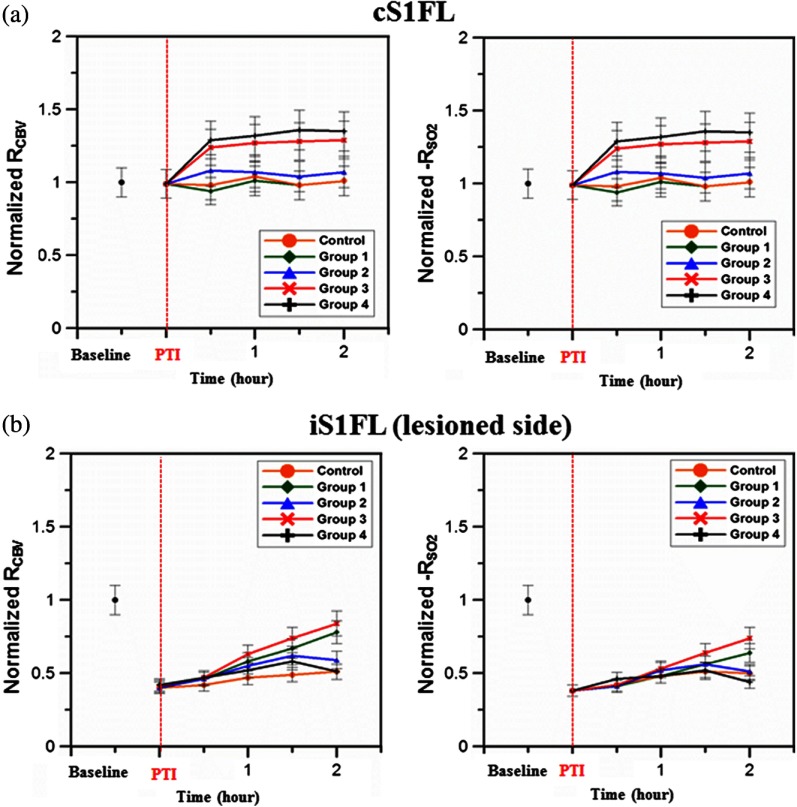
Fig. 4.
Normalized functional CBV (i.e., ) and (i.e., ) changes from cS1FL (a) and iS1FL (b) regions in different groups as a function of time. We can observe that the iS1FL values of relative CBV and in group 3 significantly increased with bilateral forepaw stimulation at 2 mA. There was partial recovery in groups 1 and 2, but group 4 values improved only slightly, compared to the PTI onset value. On the cS1FL side, the values of relative CBV and slightly increased in group 2 compared to group 1, following stimulation treatment. Similarly, group 4 exhibited higher relative CBV and changes than group 3. Standard deviations are indicated by the error bars.

