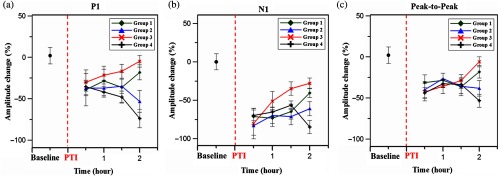
Fig. 5.

Experimental results of the three SSEP components including (a) P1 amplitude (b) N1 amplitude, and (c) peak-to-peak amplitude calculated over the iS1FL [Ch4, shown in Fig. 1(b) because it is located close to the region of PTI stroke induction]. In our study, the contralateral left forepaw stimulation was considered a reference for eliciting an evoked response. The percentage change in amplitude of the above-mentioned SSEP components was calculated compared to the baseline values. The red dashed line indicates PTI onset, and the black dot shows the baseline value of amplitude, which is a reference for calculating the percent (%) change in amplitude. As shown, there was a steady increase in P1, N1, and peak-to-peak amplitudes in groups 1 and 3 with forepaw electrical stimulation at 2 mA intensity, indicating significant recovery of neural activity. By contrast, the SSEP component values significantly decreased in both groups 2 and 4 at the end of treatment and indicate that stimulation with 4 mA is not as beneficial for recovery compared to stimulation with 2 mA.
