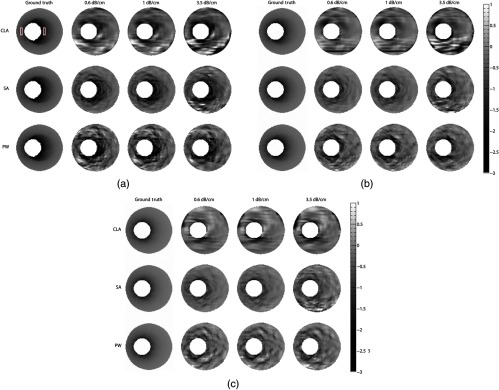
Fig. 3.

Montage of radial strain elastograms, displayed in percentage, obtained from simulated vessels with modulus contrasts of (a) , (b) , and (c) . Ideal strain elastograms are shown in the first column of each montage, and the elastograms obtained from vessel phantoms with attenuation coefficients of 0.6, 1, and are shown in the remaining columns.
