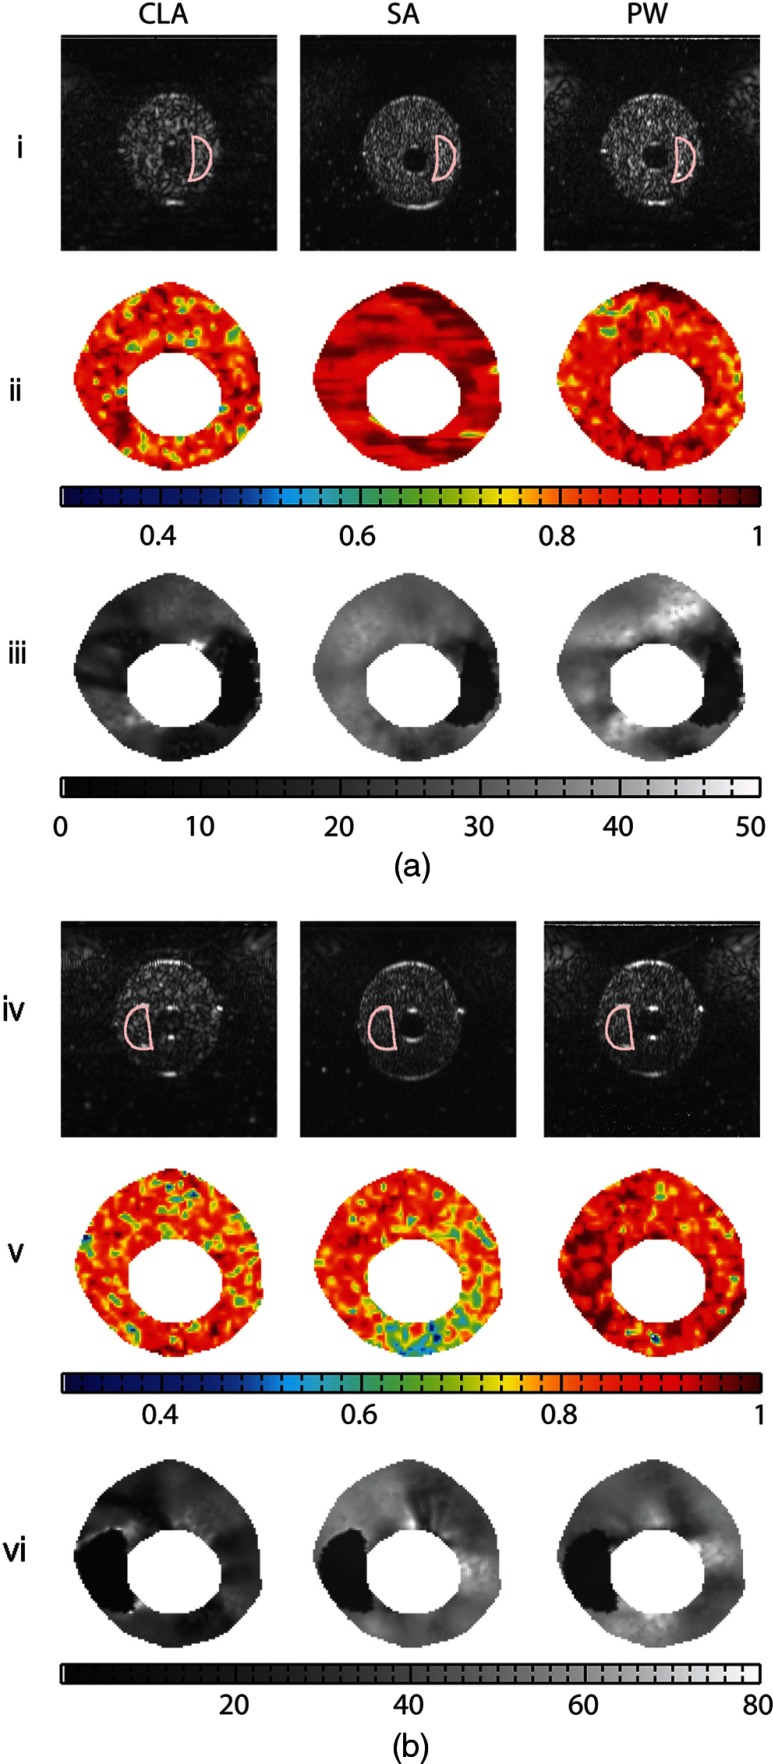
Fig. 9.
Sonograms and elastograms obtained from vessel phantoms #1 (a) and #2 (b) when elastographic imaging was performed with CLA, SA, and PW imaging. (i and iv) Sonograms, (ii and v) cross-correlation maps, and (iii and vi) modulus elastogram. In the sonogram, the crescent shape region of interest (ROI) denotes the plaque.

