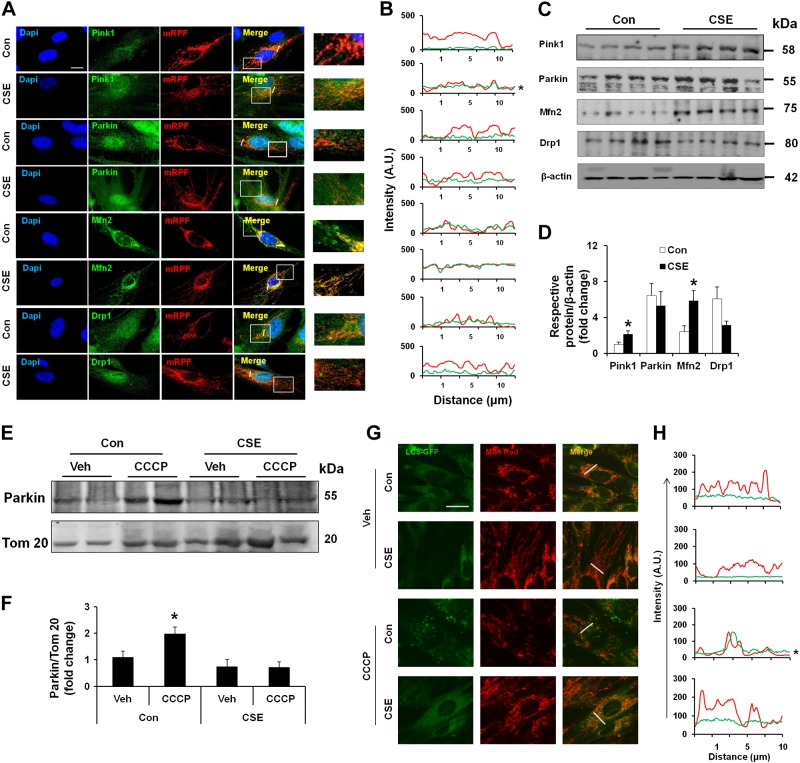
Figure 3.
CSE treatment leads to mitophagy impairment in lung fibroblasts. A) Representative images of Pink1, Parkin, Mfn2, and Drp1 (green) in HFL1 cells treated with or without CSE. Cells were transfected with mitochondria-targeted red fluorescent protein (mRPF; red) (CellLight Mitochondria-RFP, BacMam, catalog number C10505; Cell Technologies) for 24 hours before staining with respective antibodies (green) and DAPI (blue). Areas in squares are enlarged as shown on right panel. Slanting lines on images indicate the areas assessed for fluorescence intensity. Con, control. B) Line scan data of fluorescence intensity in the corresponding images to show the degree of colocalization between mRFP (mitochondria) and the respective proteins. A.U., arbitrary units. *P < 0.05 vs. control. C) Western blots of Pink1, Parkin, Mfn2, and Drp1 in whole-cell extracts prepared from HFL1 cells treated with or without CSE. β-Actin (catalog number R-22 sc-130657; Santa Cruz Biotechnology, Santa Cruz, CA, USA) was used as a loading control. Representative housekeeping loading control is shown. D) Densitometry of the respective blots. *P < 0.05 vs. control. E) Western blot of Parkin in mitochondrial extracts from HFL1 cells with or without CSE treatment. CCCP was used as a positive control to induce Parkin mitochondrial translocation. Tom 20 was used as a loading control. Veh, vehicle. F) Densitometry of the respective blots. *P < 0.05 vs. vehicle. G) Representative images of LC3-GFP (CellLight Mitochondria-GFP, BacMam, catalog number C10600; Life Technologies) expressing HFL1 cells stained with MitoTracker Red. Cells were treated with CSE (0.5%) for 15 days followed by CCCP treatment for 2 hours. Images show the colocalization of LC3-GFP with mitochondria (Mito Red) after CCCP treatment. Slanting lines on images indicate the areas assessed for fluorescence intensity. H) Corresponding line scan of fluorescence intensity shows the colocalization of LC3-GFP with mitochondria (red). *P < 0.05 vs. control. CSE was used at 0.5% with alternate day treatment for 15 days. Data are shown as the means ± sem (n = 3–4). Scale bars, 20 μm (A and G).

