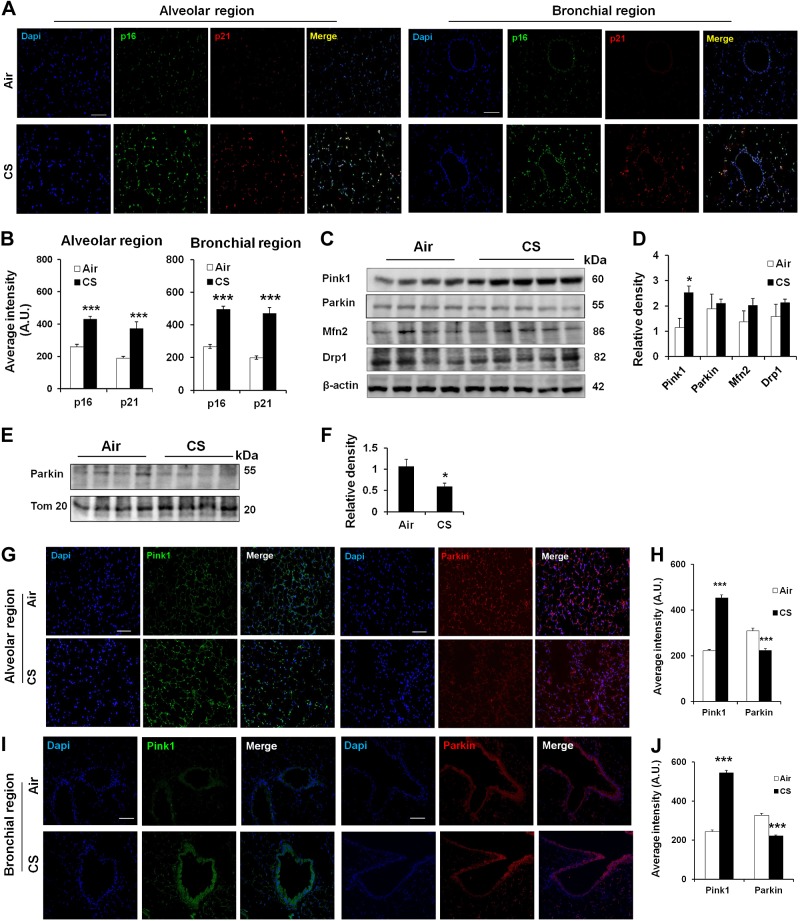
Figure 8.
Chronic CS induces impaired mitophagy in mouse lungs with emphysema. A) Representative images of alveolar and bronchial regions show p16 and p21 staining in mouse lungs exposed to CS for 6 months. Tissues were stained with p16 (green), p21 (red), and DAPI (blue). B) Average intensity of p16 and p21 was calculated using MetaMorph software. A.U., arbitrary units. ***P < 0.001 vs. Air. C) Western blot of Pink1, Parkin, Mfn2, and Drp1 in whole-cell extracts prepared from mouse lungs, and β-actin was used as a loading control. Representative housekeeping loading control is shown. D) Densitometry of the respective blots. *P < 0.05 vs. Air. E) Western blot of Parkin and Tom 20 in mitochondrial extracts prepared from lungs of mice exposed to CS for 6 months. Representative loading control is shown. F) Densitometry of the respective blots. *P < 0.05 vs. Air. G and I) Representative images of alveolar and bronchial regions show Pink1 and Parkin staining in mouse lungs. Air is the control group, and CS represents the mice exposed to CS for 6 months. Tissues were stained with Pink1 (green), Parkin (red), and DAPI (blue). H and J) Average intensity of Pink1 and Parkin staining was calculated using MetaMorph software. ***P < 0.001 vs. Air. Data are shown as the means ± sem (n = 3–4). Scale bars, 50 μm (A, G, and I).

