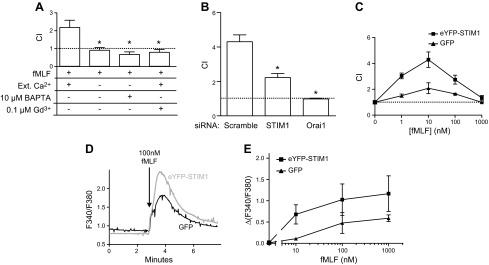
Figure 1.

Role of STIM1 in chemotaxis of dHL60 cells. A) Chemotaxis of neutrophil-like dHL60 cells was recorded with a transwell assay (see Materials and Methods). DiD-labeled dHL60 cells migrate through a fibronectin-coated membrane (3 μm hole size) in response to 100 nM fMLF placed in the bottom well. Chemotaxis index was recorded in the presence of 2 mM Ca2+, plus 0.1 μM gadolinium or in nominally Ca2+-free medium with or without 10 μM BAPTA. Means ± sem from 3 independent experiments. *Significant difference compared with 2 mM extracellular condition (P < 0.05) based on 1-way ANOVA followed by Bonferroni’s test. B) Chemotaxis index of dHL60 cells nucleotransfected with siRNA for STIM1 or Orai1 monitored in the presence of 2 mM Ca2+. Means ± sem from 3 independent experiments. *Significant difference compared with scrambled siRNA control (P < 0.05) based on 1-way ANOVA followed by Bonferroni’s test. C) Chemotaxis index of dHL60 cells overexpressing GFP or eYFP-STIM1 migrating in response to 0–1000 nM of fMLF in the bottom well. Means ± sem from 3 independent experiments. D) Intracellular Ca2+ concentration increases induced by 100 nM fMLF in GFP and eYFP-STIM1 overexpressing dHL60 cells. Traces represent average calcium response of 30 cells measured on a single coverslip. E) Relative intracellularCa2+ concentration in GFP and eYFP-STIM1 overexpressing dHL60 cells in response to increasing concentrations of fMLF. Mean calcium responses above baseline (ΔF340/380) ± sem from 3 coverslips. For D and E, Rmax was 3.3.
