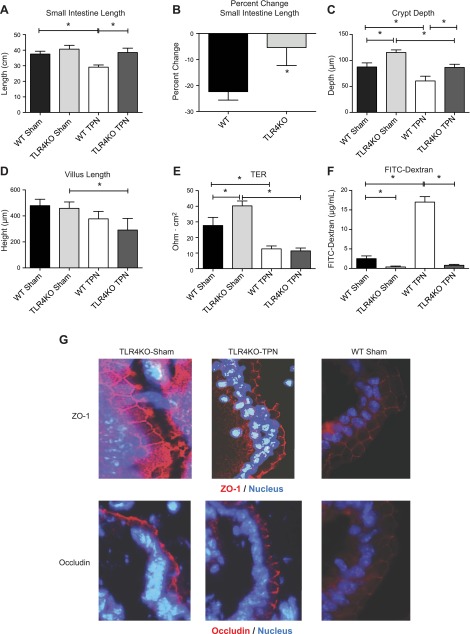
Figure 1.
Gross and microscopic morphometric measurements of TLR4KO and WT mice. A) Mean small intestine lengths. B) Percentage change in small intestine length with TPN administration in WT and TLR4KO groups. C) Differences in crypt depth. D) Differences in villus length. Results represent means ± sd, n = 6/group. *P < 0.05. E) Differences in transepithelial resistance for each study group. F) Permeability of FITC-dextran for each study group. G) Representative images of ZO-1 and occludin staining for each group.

