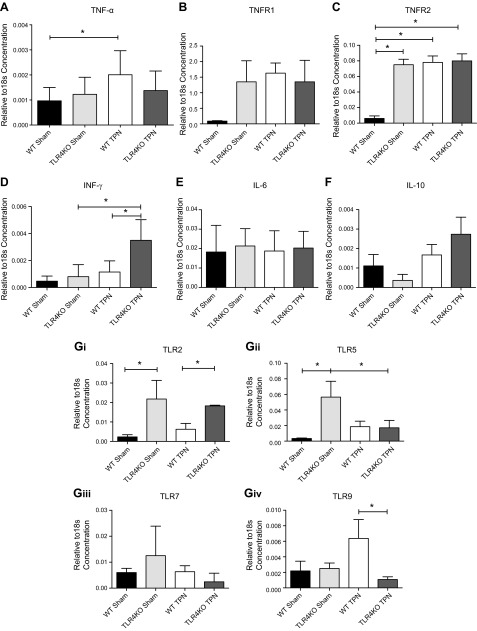
Figure 5.
mRNA cytokine expression using RT-PCR of selected cytokines and receptors and TLRs. A) Changes in TNF-α. B, C) Changes in TNFR1 and TNFR2, respectively. D) changes in IFN-γ. E, F) Changes in IL-6 and IL-10, respectively. Gi–iv) show changes in selected TLRs as a result of the knockout of TLR4 by RT-PCR. mRNA expression is corrected to the expression of 18S. Results represent means ± sd, n = 6/group. *P < 0.05.

