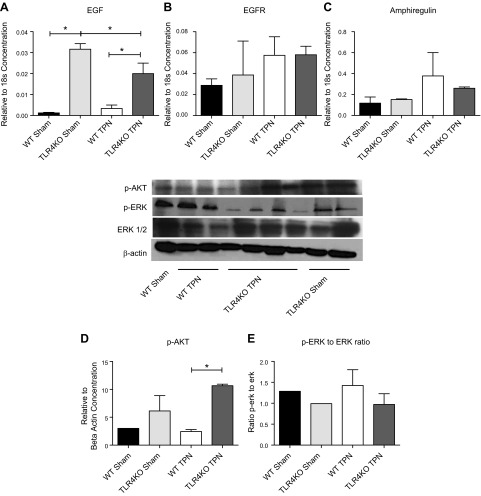
Figure 6.
EGF/EGFR and downstream signaling factors. A, B) Changes in EGF and EGFR, respectively, by RT-PCR of jejunal mucosal scrapings. C) Changes in amphiregulin by RT-PCR. D, E) Representative blots from analysis of Western immunoblots of epithelial cell lysate. D) Ratio of p-AKT to β-actin. E) Ratio of phosphorylated Erk to Erk. Results represent means ± sd, n = minimum of 5/group. *P < 0.05.

