Figure 2.

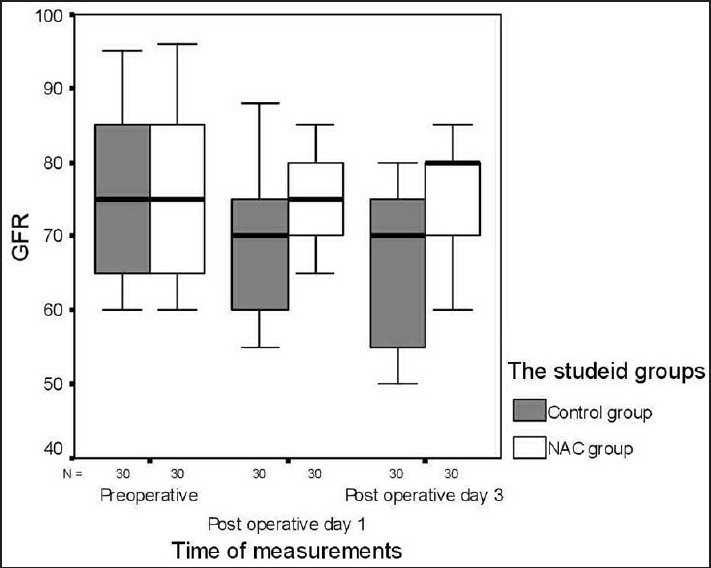
Box and whiskers graph of cystatin C glomerular filtration rate (ml/min/1.73 m2) in the two studied groups. N-acetylcysteine group

Box and whiskers graph of cystatin C glomerular filtration rate (ml/min/1.73 m2) in the two studied groups. N-acetylcysteine group