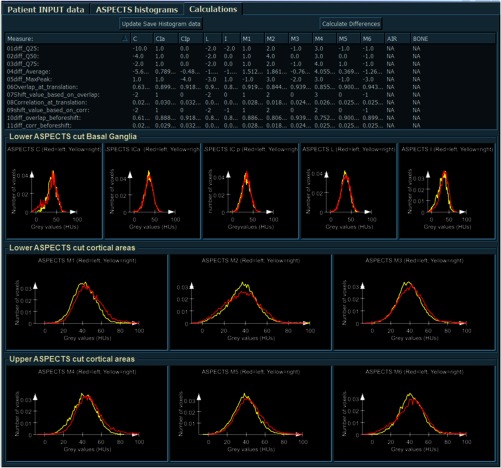
Fig. 2.
Capture of the graphical interface of the automated brain densitometry method based on the ASPECTS regions. The top row represents the different BDS measures per ASPECTS regions. The bottom rows are visualizations of the density distributions of the ASPECTS regions. From left to right, top to bottom: caudate nucleus; anterior and posterior part of internal capsule (for the ultimate quantification, these two regions were merged into one region, conform manual ASPECTS); lentiform nucleus; insular ribbon; M1; M2; M3; M4; M5, and M6. Red (gray) curves represent histograms of the left hemisphere and yellow (white) curves of the right hemisphere. A leftward shift of the yellow curve towards the lower density values indicates a hypodensity in the right hemisphere. The internal capsula area was divided in an anterior and a posterior part, to ensure detection of EICs when only a single part of the capsula was affected.

