Fig. 4.

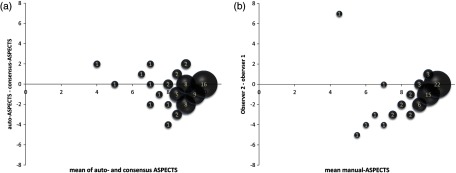
Bland-Altman plots of (a) auto-ASPECTS versus consensus-ASPECTS and (b) differences between observers. The size of the circles and the value inside indicate the number of cases with the same result.

Bland-Altman plots of (a) auto-ASPECTS versus consensus-ASPECTS and (b) differences between observers. The size of the circles and the value inside indicate the number of cases with the same result.