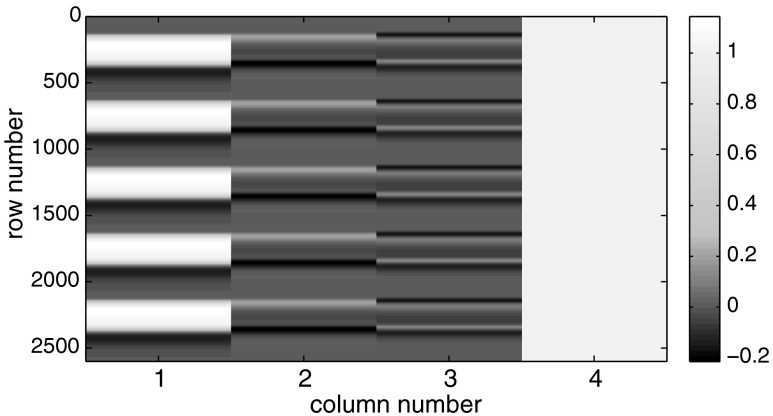
Fig. 1.
An example of a design matrix X. As described in Sec. 2.4, a peak delay was set as . The row number indicates the number of samples. The first, second, third, and fourth columns indicate the canonical HRF , the derivatives, the second derivatives, and the constant, respectively.

