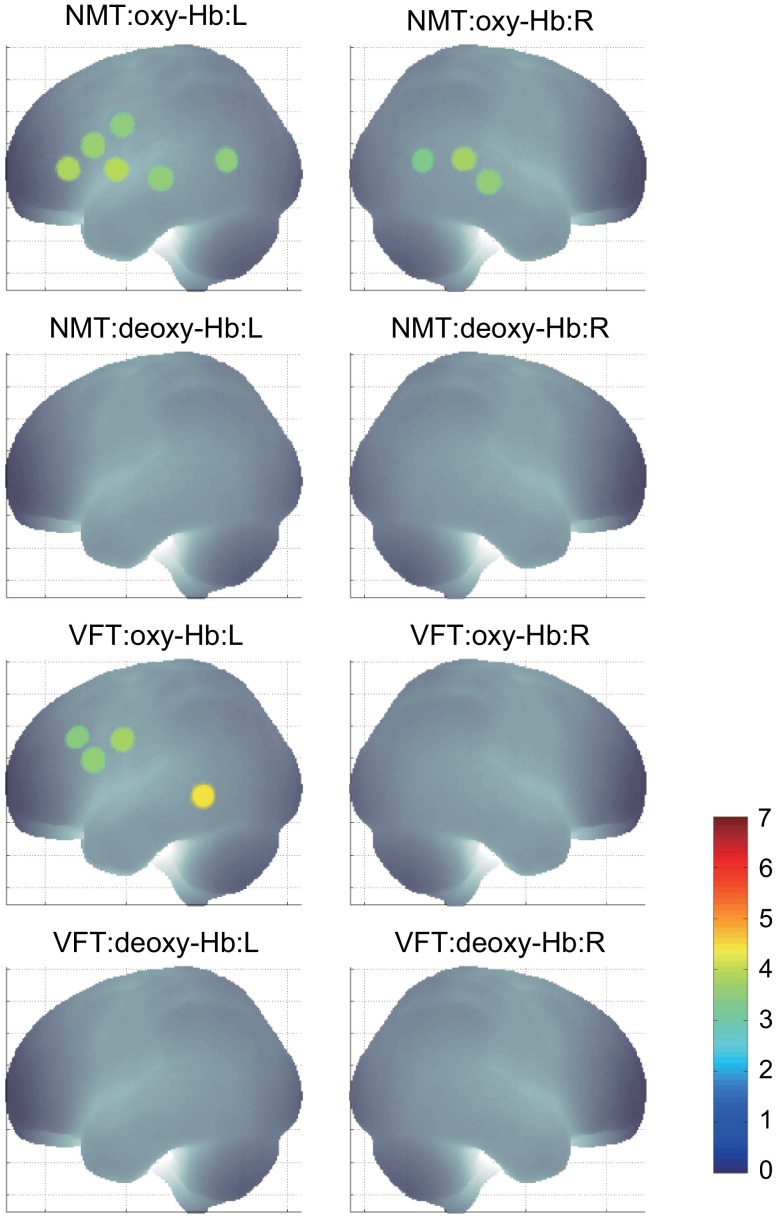
Fig. 4.
The results of the group analysis using 6 s . A -value of less than 0.05 was considered significant, and family wise errors due to multichannel measurement were corrected using the Bonferroni method. Significant -values for MNI-registered channels are indicated by color scale. From top to bottom, the maps respectively indicate analyses of the oxy-Hb signal for the NMT, the deoxy-Hb signal for the NMT, the oxy-Hb signal for the VFT, and the deoxy-Hb signal for the VFT. Significant activations were detected only with oxy-Hb signals for the NMT on both hemispheres and oxy-Hb signals for the VFT on the left hemisphere.

