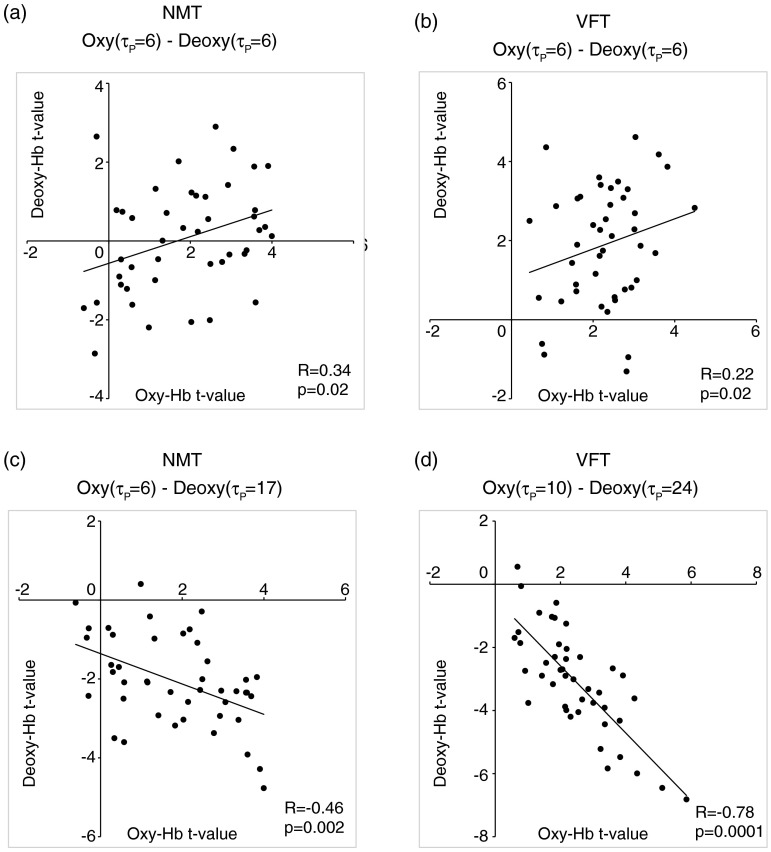
Fig. 6.
Correlation analyses for -values between oxy-Hb and deoxy-Hb signals among 44 channels. (a) Correlation analysis for the NMT using the peak delay (Oxy · Deoxy: ) for the typical condition. (b) Correlation analysis for the VFT using the peak delay (Oxy · Deoxy: ) for the typical condition. (c) Correlation analysis for the NMT using the optimal peak delay (Oxy: , Deoxy: ). (d) Correlation analysis for the VFT using the optimal peak delay (Oxy: , Deoxy: ).

