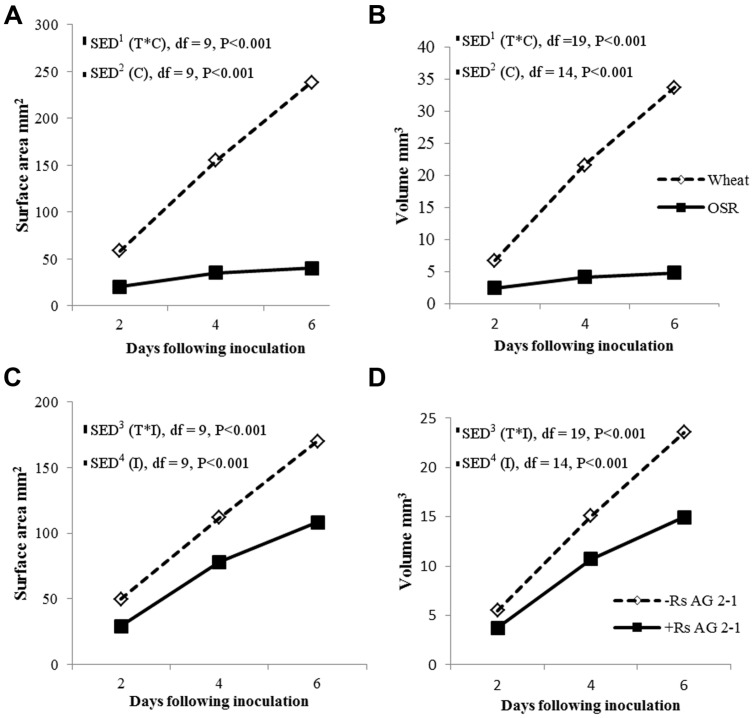
FIGURE 4.
Root system volume and surface area over time (T) for crop (C), (A,B) and inoculation (I) with R. solani AG2-1 (C,D). Interactions for surface area and volume were detected using repeated measures ANOVA with degrees of freedom (df) corrected by Greenhouse–Geisser epsilon factor. Bars show SED for (1) comparing means for treatment combinations; (2) comparing means with the same level of C; (3) for comparing means for the same level of I and species (wheat or OSR); (4) comparing means with the same level of I.

