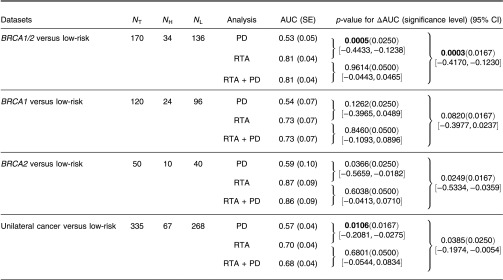
Fig. 2.

Performance comparison on the contribution of RTA and PD on the breast cancer risk assessment on FFDM. Results are shown with age-matched analyses. Leave-one-case-out (round-robin) analysis was performed on FFDM. RTA, radiographic texture analysis; PD, percent density; AUC, area under the fitted ROC curve; SE, standard error; CI, confidence interval; , number of total cases; , number of high-risk cases; and , number of low-risk cases. Bold implies statistical significance achieved after multiple comparison correction.
