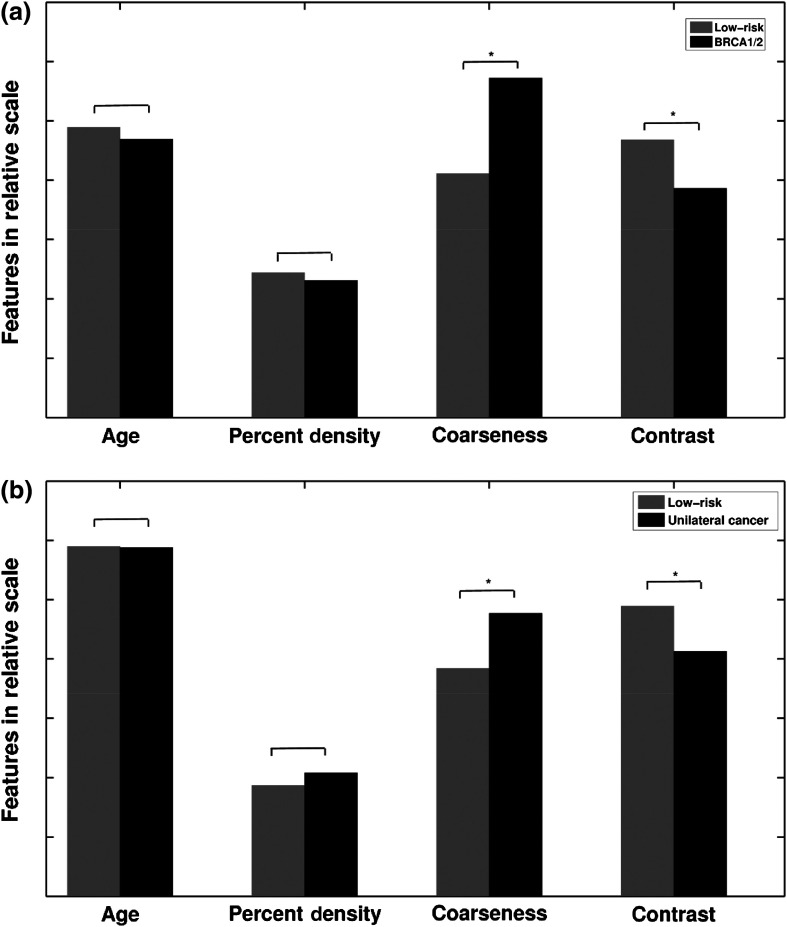
Fig. 3.
Statistical comparison of age-matched high-risk and low-risk groups in terms of the sample means for age, PD, parenchymal coarseness, and parenchymal contrast. (a) BRCA1/2 and low-risk; (b) unilateral cancer and low-risk; * indicates statistical significance was achieved using the two-sample -test after correction for multiple comparisons. Values are given in Table 2.

