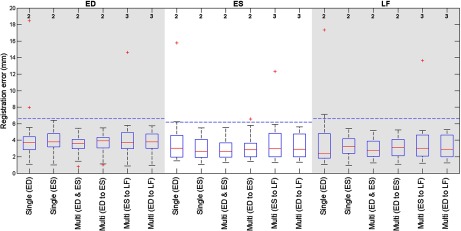
Fig. 2.

Boxplot showing the registration errors at end diastole (ED), end systole (ES) and the last time frame (LF) for the different registration strategies. NCC was used as metric. Multiframe registration with ED and ES frames results in the smallest deviation in the registration errors. At the top the number of data sets with a registration error over 20 mm is given. The horizontal (dashed) lines give the maximal interobserver transformation distance, or ITD, for the different temporal frames.
