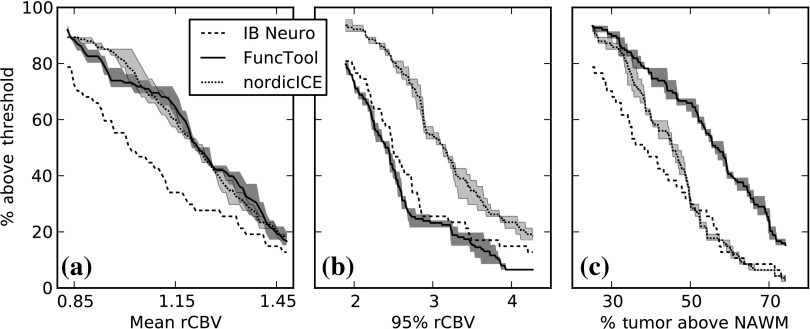
Fig. 4.
Percent of subjects above rCBV metric threshold. The lines represent the software-specific averages across the three operators. The shaded area on either side represents the interoperator range for that software. (a) Shows the percentage of cases that are above threshold using the mean rCBV value as the metric. (b) Shows the percentage of cases that are above threshold using the intensity of the 95th percentile as the metric. (c) Shows the percentage of cases that are above threshold using the percentage of tumor voxels with rCBV above white matter as the metric.

