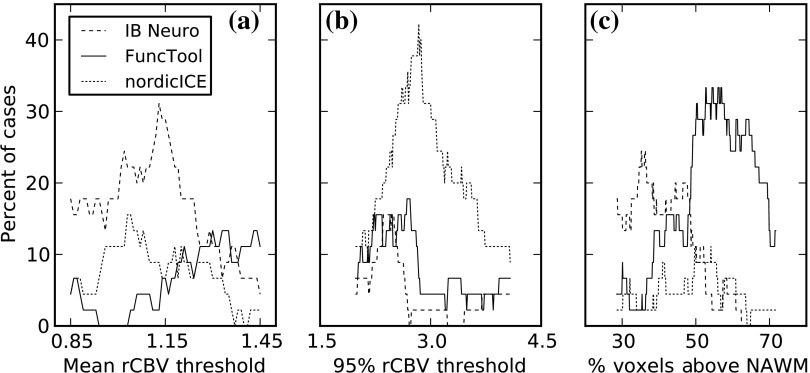
Fig. 6.
Percentage of cases where one software package disagreed from other two (by software). Operator 1’s data. The axis range plotted is for all software’s percent of cases above the threshold (as shown in Fig. 4) being between 25% and 75%. The threshold is used to differentiate between pseudoprogression and progression. (a) The percentage of cases where one software package disagreed from the other two across a range of mean rCBV thresholds. (b) The percentage of cases where one software package disagreed from the other two across a range of 95th percentile rCBV thresholds. (c) The percentage of cases where one software package disagreed from the other two across a range of thresholds for percent of voxels above NAWM.

