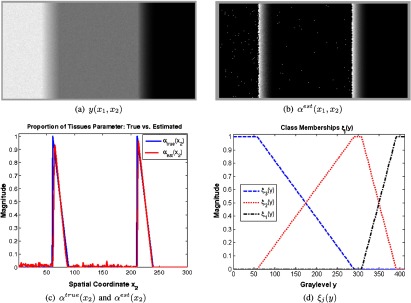
Fig. 2.

PVA fraction estimation. Top: simulated image with three pure tissues (a) and estimated partial volume fraction in two dimension (b). Bottom: Averaged (along columns) one-dimensional scanline of (b) versus the ground truth (c) and corresponding class memberships (d).
