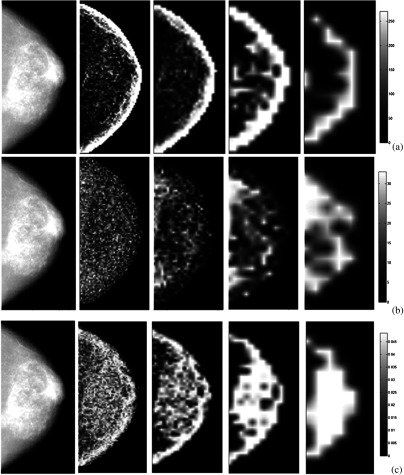
Fig. 6.
Illustration of the effect of the window size () on the texture feature images. Representative examples shown in each row, from left to right, for GE 2000D raw images (after -log transformation) and corresponding texture feature images with increasing window sizes of 15, 31, 63, and for texture features (a) STD (gray-level histogram); (b) GLN (run length); (c) EEI (structural). The texture feature images are generated from z-score normalized raw images acquired on the GE 2000D system.

