Fig. 7.

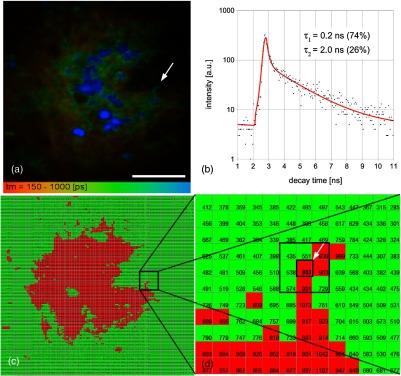
(a) Fluorescence lifetime image of upper dermis; (b) decay curve of the marked pixel (arrowhead; elastin fiber) in (a); (c) single photon counting image (pixel color: ; ); and (d) magnified section of the framed part in (c). Scale bar: .

(a) Fluorescence lifetime image of upper dermis; (b) decay curve of the marked pixel (arrowhead; elastin fiber) in (a); (c) single photon counting image (pixel color: ; ); and (d) magnified section of the framed part in (c). Scale bar: .