
Fig. 7.
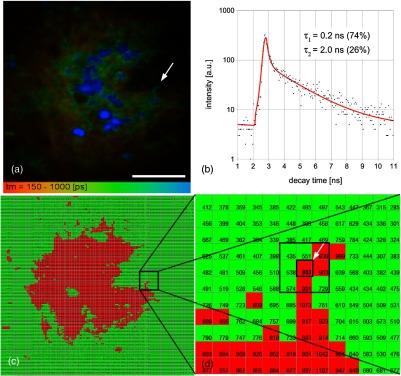
(a) Fluorescence lifetime image of upper dermis; (b) decay curve of the marked pixel (arrowhead; elastin fiber) in (a); (c) single photon counting image (pixel color: ; ); and (d) magnified section of the framed part in (c). Scale bar: .
Official websites use .gov
A
.gov website belongs to an official
government organization in the United States.
Secure .gov websites use HTTPS
A lock (
) or https:// means you've safely
connected to the .gov website. Share sensitive
information only on official, secure websites.
(a) Fluorescence lifetime image of upper dermis; (b) decay curve of the marked pixel (arrowhead; elastin fiber) in (a); (c) single photon counting image (pixel color: ; ); and (d) magnified section of the framed part in (c). Scale bar: .