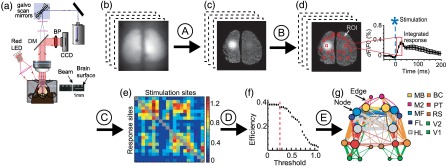
Fig. 2.

Workflow for network analysis and the creation of network diagrams from functional voltage-sensitive dye imaging and channelrhodopsin-2 stimulation: (a) experimental setup for simultaneous ChR2-photostimulation and VSD imaging; (b) raw, time-series VSD images were collected and processed offline using MATLAB®; (c) raw images were normalized, filtered, and averaged across 2 to 10 photostimulation trials to determine responses (see “NetworkAnlaysis_VSD” code Section A); (d) twenty different regions of interest [regions of interest (ROIs); red boxes] were selected (left) to measure VSD responses. An example time course of the VSD response from a single ROI is shown on the right (see “NetworkAnlaysis_VSD” code Section B); (e) VSD responses were represented as a weighted connection matrix (see “NetworkAnlaysis_VSD” code Section C); (f) a number of threshold levels were tested with various network properties using the Brain Connectivity Toolbox15 to determine a threshold that would retain only the strongest network connections without changing the global network properties (red dashed line; see “NetworkAnlaysis_VSD” code Section D); (g) this threshold was applied to the connection matrix and a network diagram was created (see “NetworkAnlaysis_VSD” code Section E). DM = dichroic mirror; BP = bandpass filter; MB = motor barrel cortex; M2 = secondary motor cortex; MF = motor forelimb area; FL = forelimb area of the primary somatosensory cortex; HL = hindlimb area of the primary somatosensory cortex; BC = barrel cortex; PT = parietal cortex; RS = retrosplenial cortex; V1 = primary visual cortex; and V2 = secondary visual cortex.
