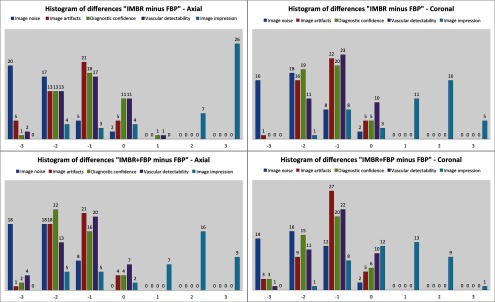
Fig. 4.

The barplots of differences for “IMBR minus FBP”—axial (panel A),”IMBR minus FBP”—coronal (panel B), “ minus FBP”—axial (panel C), and “ minus FBP”—coronal (panel D). Note that the absolute frequencies of observed differences are represented with respect to the reference values. (See text for details).
