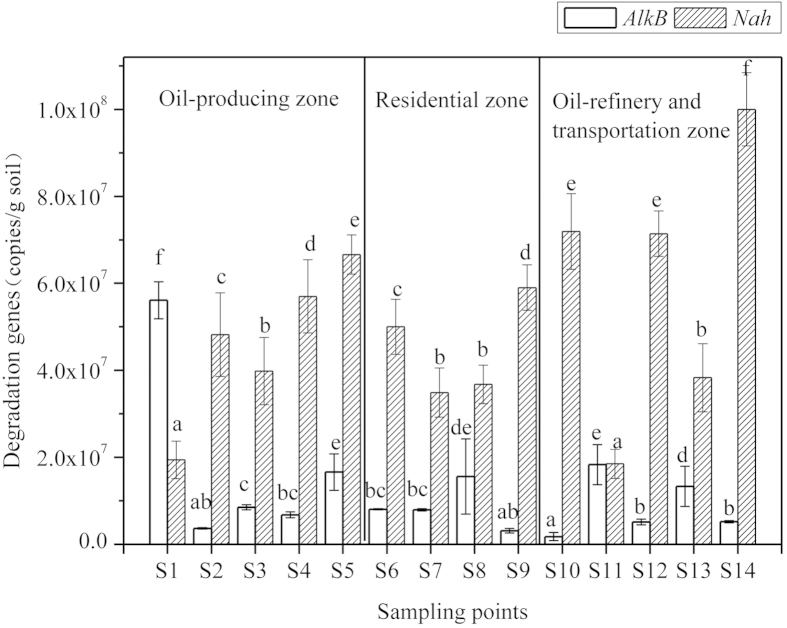
Figure 1. Distribution of AlkB and Nah degradation genes in all the Dagang Oilfield soil samples.
Error bars represent standard deviations of efficiencies for PCR. Letters on the columns indicate a significant difference among sites at p < 0.05 according to Duncan’s multiple range tests of One-Way ANOVA.

