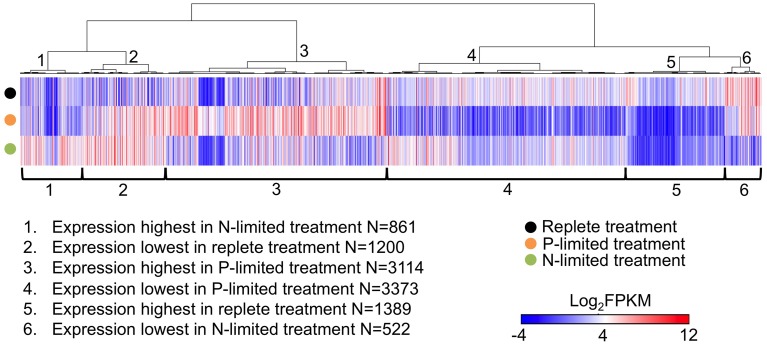
Figure 1.
Heatmap of expression levels (in the form of FPKM values) of all differentially expressed genes (between at least one pair of treatments) in three treatments. Each thin column represents a single gene and its expression level in three treatments, Genes were arranged by hierarchical clustering (1-Pearson correlation, average linkage) of their expression patterns. When calculating Pearson correlation values, FPKM values smaller than zero were transformed to zero to reduce the impact of sub-zero FPKM values because they were mostly derived from very small read counts which have virtually no statistical significance. FPKM is the fragments per kilobase per million fragments mapped.

