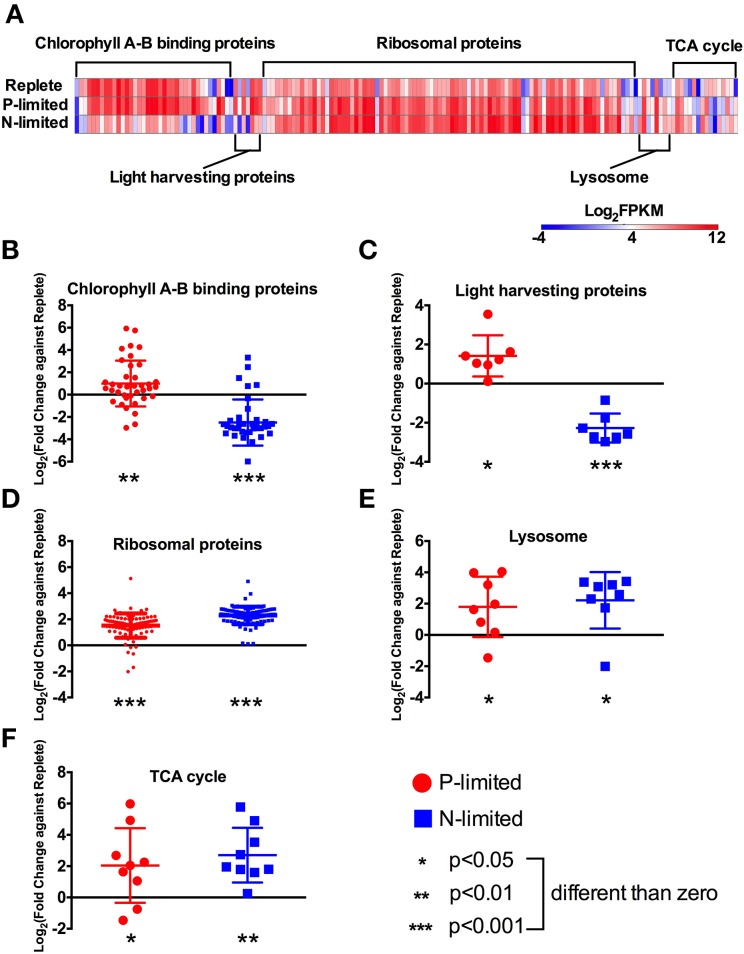
Figure 4.
Expression levels and fold changes of selected functions and pathways. (A) Heatmap of all differentially expressed genes involved in targeted functions/pathways. Log2 (fold change against the replete treatment) in both P-limited and N-limited treatments were plotted for genes encoding chlorophyll A-B binding proteins (B), light harvesting proteins (C), ribosomal proteins (D), lysosomal proteins (E), and TCA cycle proteins (F). For each category, a dot represents a single gene; bar represent mean ± SD of the Log2 fold change. For each category and each treatment, t-tests were carried out to test whether the Log2 fold change values were significantly different from 0, i.e., whether these genes are differentially expressed compared to the replete treatment, collectively. Different p-values are represented by different numbers of stars. For a list of these genes and their read counts and FPKM values, see Table S1.

