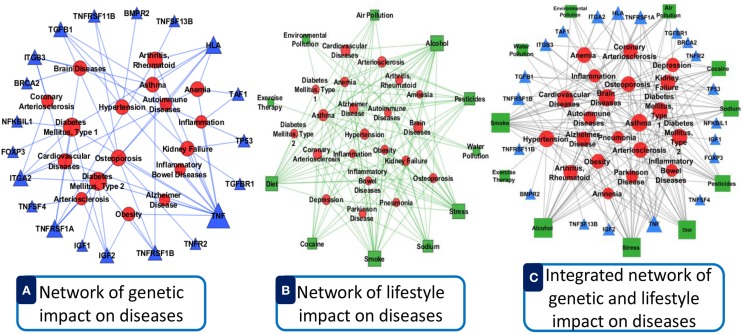
Figure 11.
Comparative representation of dysregulated genes and lifestyle impact on the disease comorbidity. (A) Represents an example of only dysregulated genetic influences on diseases with good lifestyle. (B) Shows an example of only bad lifestyle influences on diseases with no genetic variation. (C) Represents the combined impacts of lifestyle and dysregulated genes on diseases. Here, the circular red nodes nodes represent diseases name, triangular blue nodes represent genes symbols and square green nodes represent lifestyle factors. The size of the nodes represents the degree of associations.

