
Fig. 4.
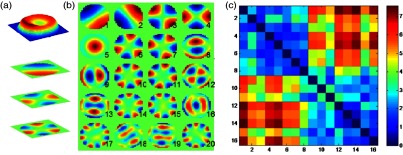
(a) Quantitative phase image of a red blood cell (RBC) in a perspective color coded representation and projections of three principal component analysis (PCA) modes of the RBC cell membrane fluctuations. (b) Degeneracy free representation of 20 PCA modes, measured experimentally. (c) Each -value (i,j) in the matrix indicates how similar the energy distributions of the PCA modes between subject and subject are. At lower -values, the energy distribution becomes more similar. Healthy (1–8) and diabetic (9–16) samples can be discriminated.