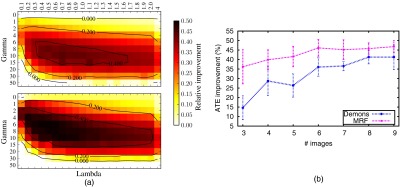
Fig. 6.

(a) CBRR performance with changing regularization for (b) relative ATE improvement with increasing demons (top) and MRF (bottom) registration. (b) Relative ATE improvement using CBRR with an increasing number of 2D MR images. Each experiment is repeated 10 times with randomly selected images. The standard deviation of the results is shown by the error bars.
