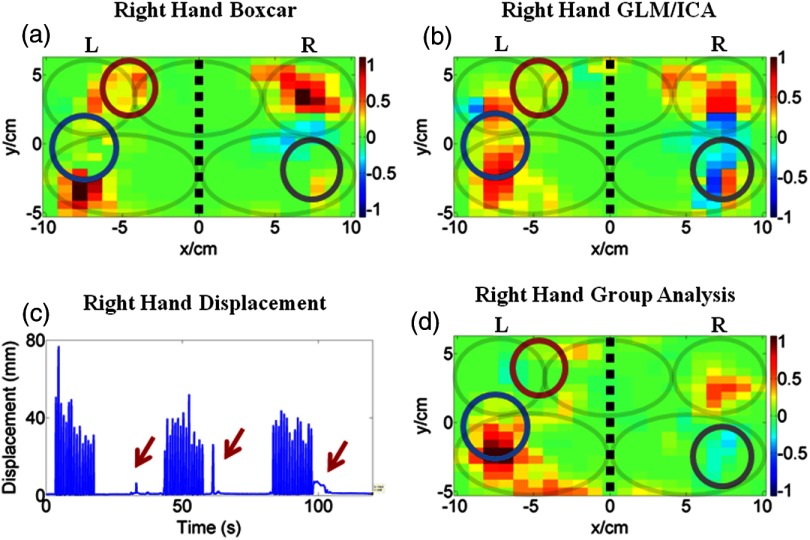
Fig. 6.
Comparison of activation images made with the GLM/ICA method and a boxcar regressor for control subject 9 performing right hand tapping. (a) Activation image made using a boxcar regressor. (b) Activation image made with the modified GLM/ICA method. (c) Vertical position of nail target on tapping (right) hand. (d) Group analysis including six typically developing children as control subjects. The black dashed lines indicate the midline and the gray ovals indicate the M1/S1 and PMC of each hemisphere and the SMA shared between hemispheres.

