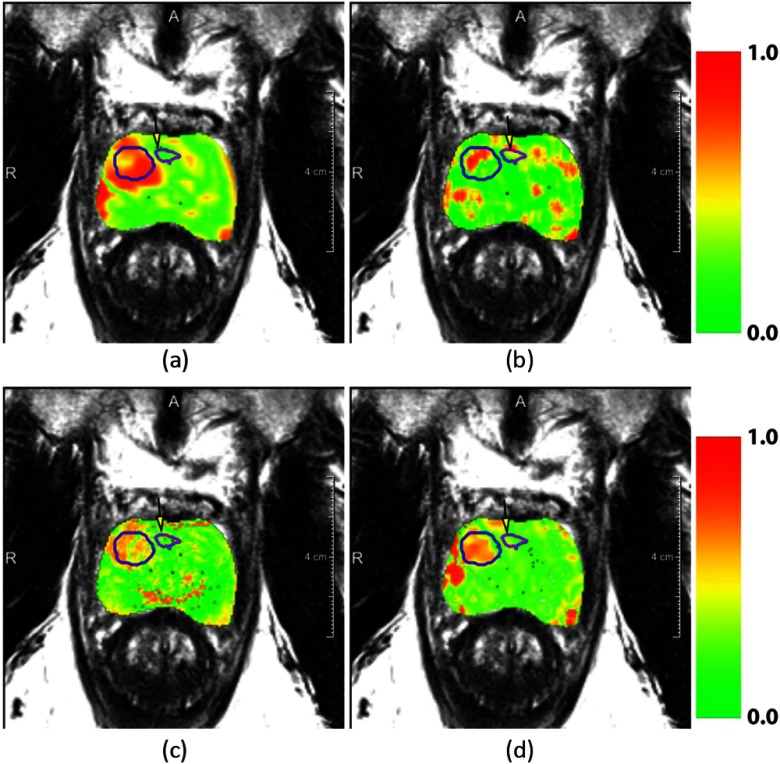
Fig. 5.
Overlays of normalized feature change between pre- and post-treatment MRIs. Figures (a), (b), (c), and (d) represent the features , Haralick correlation, (Pseudo)T2-Map, and respectively. In the overlay, red indicates areas of high relative change and green of low relative change. The successfully ablated area is indicated in a blue contour and the purple contour indicates residual disease. The residual disease area is also indicated with a yellow arrow.

