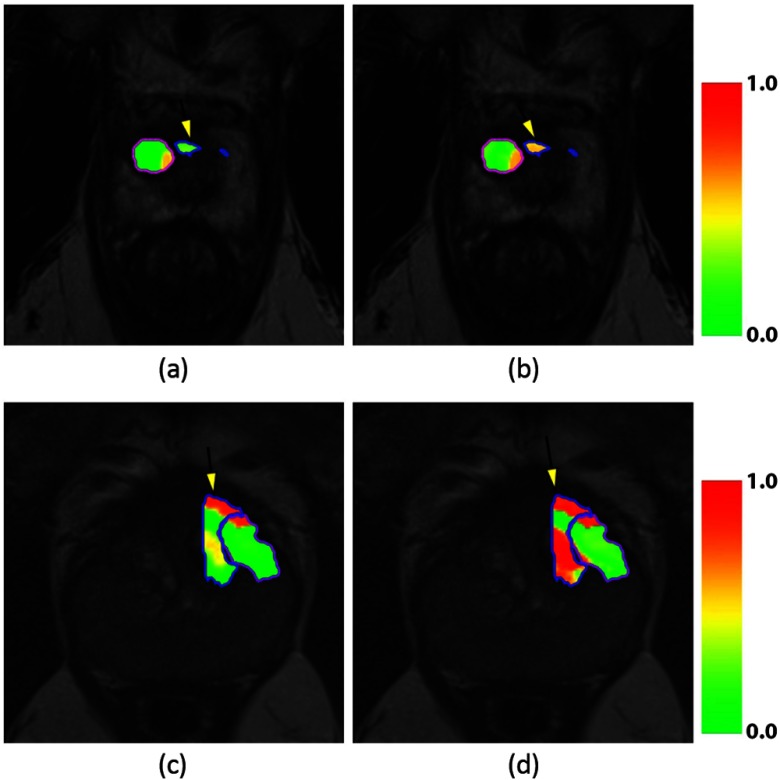
Fig. 7.
Likelihood heat maps for the fuzzy C-means clustering separating treatment effects and residual disease. Patient 1 (a and b) and patient 3 (c and d) are shown. Figures (a and c) show the results obtained when only including post-LITT MRI feature, whereas figures (b and d) show the improvement obtained by incorporating the 10 highest scoring features (Table 2). Residual disease in blue, ablated area in purple. The residual disease area is also indicated with a yellow arrow.

