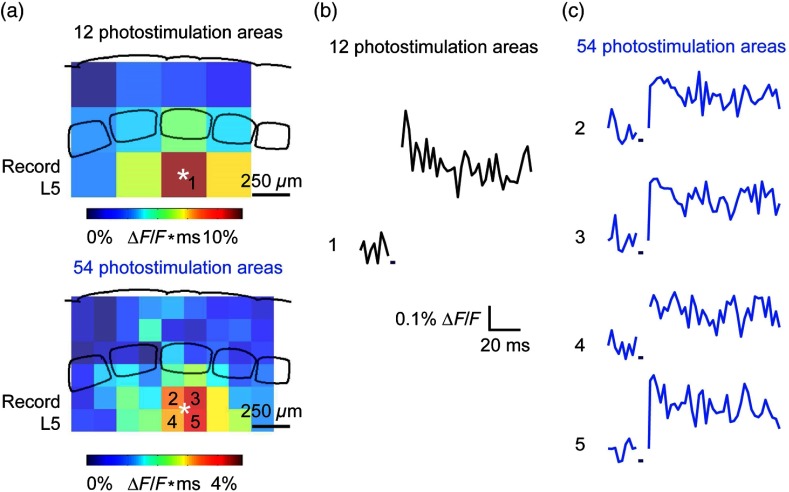
Fig. 5.
All-optical mapping can be done at a higher resolution. (a) Input response map for layer 5 of column C of slices from a P113 mouse done at lower (12 photoactivation areas, top) and higher (54 photoactivation areas, bottom) resolution. Integrated responses elicited at the region denoted by an asterisk following photostimulation of various areas on the slice were color-coded accordingly. Input map responses were integrated from 7.4 to 25 ms after the onset of the light flash. (b) and (c) Averaged optical traces show responses measured in layer 5 (indicated by asterisk) when photostimulating in layer 5. A more refined response map can be obtained at higher resolution of photostimulation, showing differential amounts of light-evoked responses within a region that would otherwise be masked at a lower resolution. Traces are numbered as indicated on the map.

