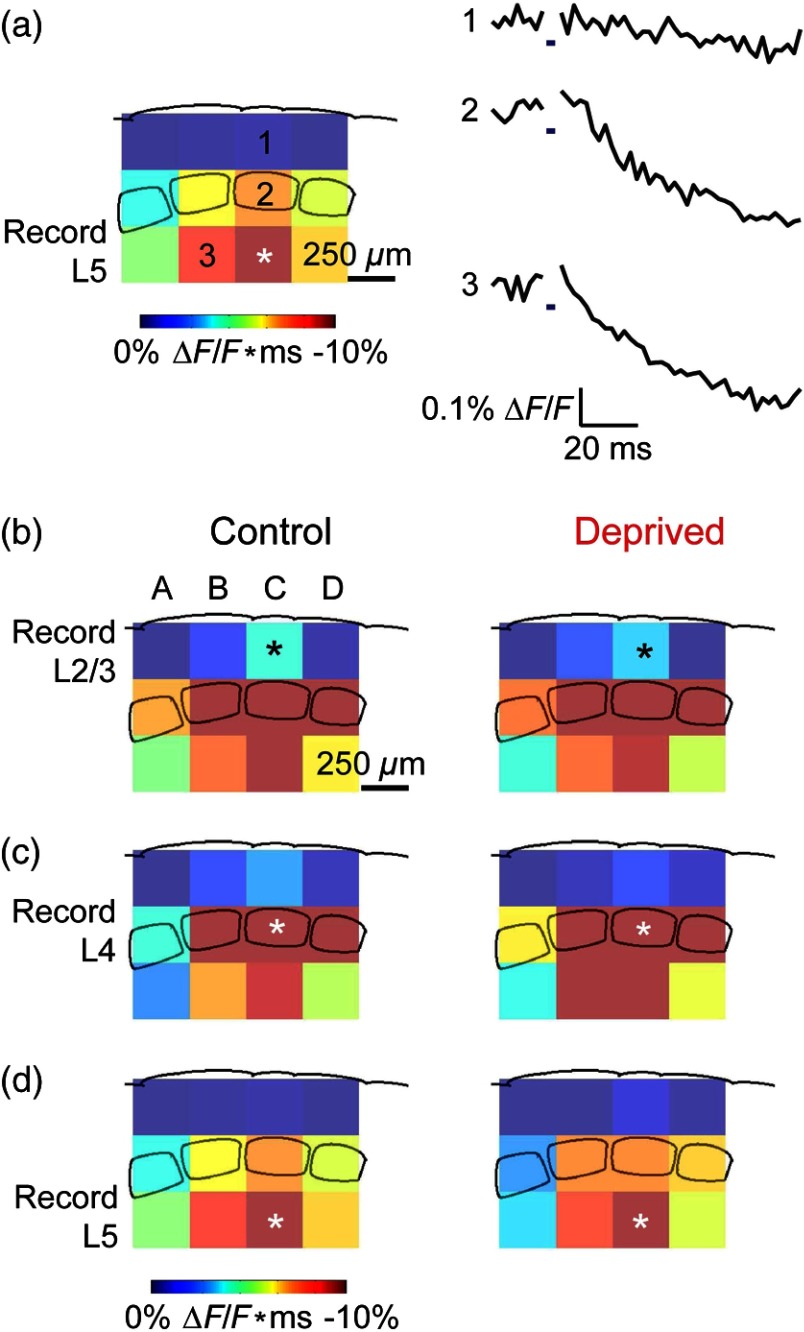
Fig. 7.
All-optical mapping of column C responses with ChR2 photostimulation and VSD imaging. (a) Averaged control input response map (left; ) for layer 5 of column C. Input map responses were integrated from 7.4 to 25 ms after the onset of the light flash. Averaged optical traces (right) showing responses measured in layer 5 (indicated by asterisk) when photostimulating layers and 4 of column C and layer 5 of column B. Traces are numbered as indicated on the map. (b) to (d) Averaged input response maps () for column C, showing the strength of compound IPSP input from surrounding layers and columns of the slice. Position of asterisk indicates layer and column of area from which responses were calculated. Response maps show similar input patterns between controls and deprived slices.

