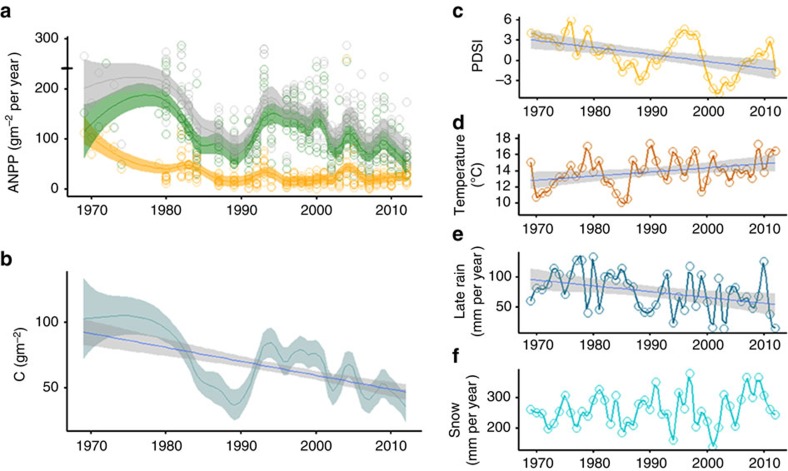
Figure 1. Long-term pattern of grassland production and climate variation.
(a) Above-ground net primary production in control plots showing all plot data (points) and locally weighted trend lines with 95% confidence bands for total (grey), grass (green) and forb (orange) production. The horizontal black bar on the y axis is ANPP for 1965–1967 at a nearby subalpine grassland (ref. 20). (b) Change in total above-ground carbon pools with 95% confidence bands. (c) Time series of the regional Palmer Drought Severity Index (PDSI, lower values indicate increasing dryness), (d) September temperature, (e) late-summer rainfall and (f) annual snowfall. All significant (P<0.001) trends in b–f are shown with a regression line (blue) and 95% confidence intervals.

