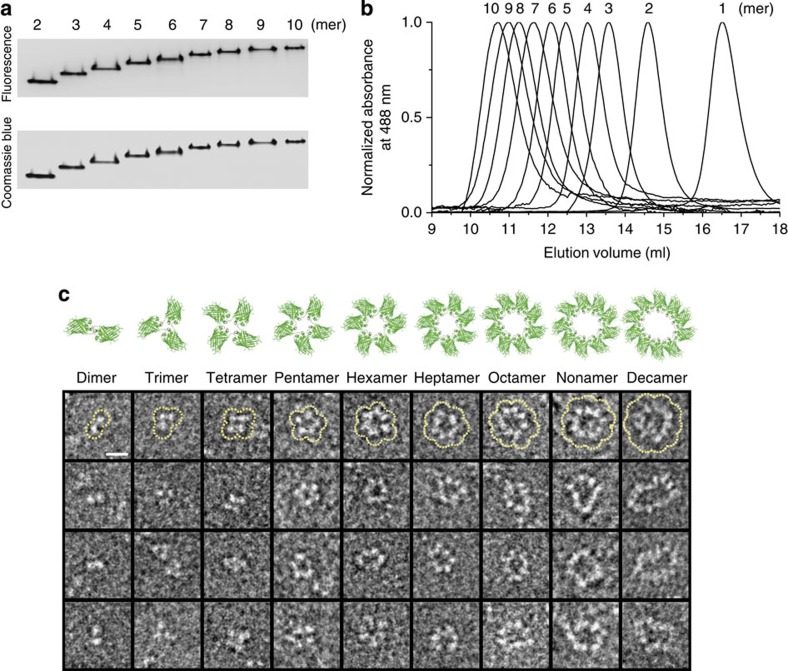
Figure 2. Size-distribution analysis and visualization of discrete GFP polygons.
(a) Native PAGE analysis of purified GFP polygons from dimer to decamer. The gel was analysed by a fluorescent image analyser (top) and Coomassie blue staining (bottom). (b) SEC analysis of discrete GFP polygons from monomer to decamer. Absorbance spectra (at 488 nm) were normalized on their maximum peaks. (c) Representative TEM images and schematic drawings of discrete GFP polygons. Polygonal GFP arrangements in TEM images (the first row) were outlined by dotted yellow lines. Scale bar, 10 nm.

