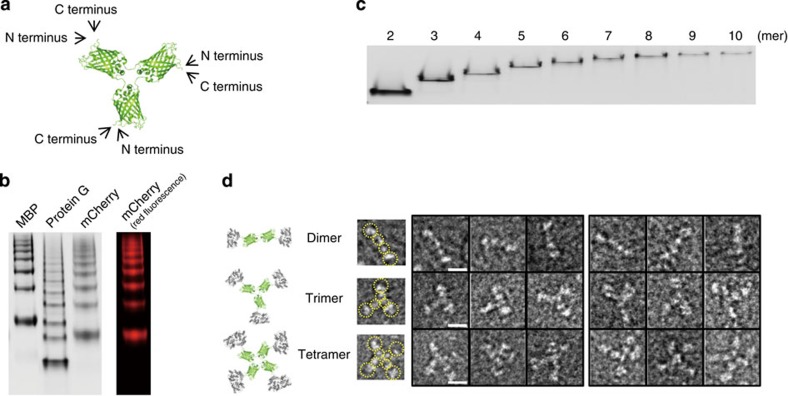
Figure 3. Multivalent display of functional proteins on GFP polygons.
(a) Schematic drawing of the triangular GFP oligomer with locations of N and C termini. (b) Native PAGE analysis of MBP-, protein G- and mCherry-displayed polygons. The gel was analysed by a fluorescent image analyser with 470-nm excitation and 530-nm emission filters (left), and 625-nm excitation and 695-nm emission filters (right). (c) Native PAGE analysis of discrete protein G polygons from dimer to decamer. (d) Schematic drawing and TEM images of N- (left set of panels) and C- (right set of panels) terminal-fused MBP polygons from dimer to tetramer. MBP and GFP are shown respectively in grey and green. Protein arrangements in TEM images (copies of those in the first column) were indicated with dotted yellow circles. Scale bars, 10 nm.

