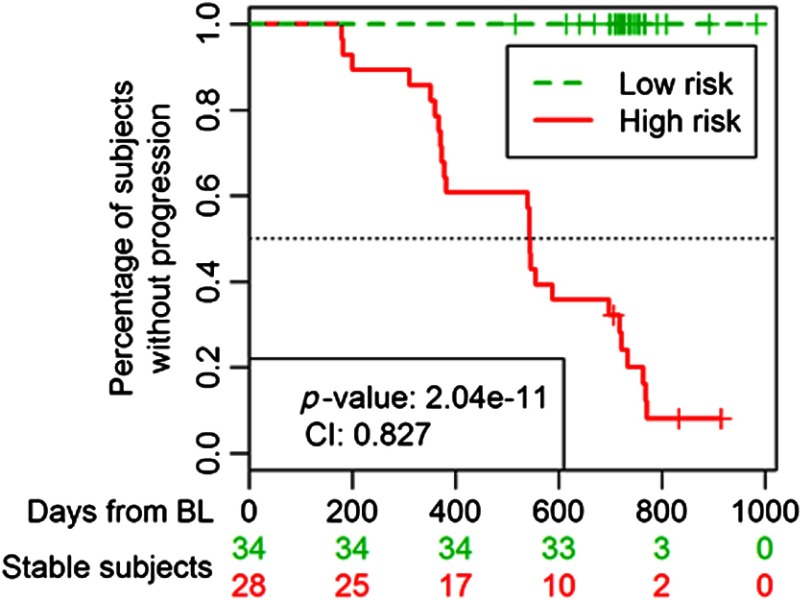
Fig. 3.
Kaplan-Meier curve showing the different times to event between low- and high-risk groups. The median of the PI was used as the threshold to define group membership. The PI was defined as the linear predictors of the logistic regression model with the features of the proposed biomarker applied to the whole population in this study.

