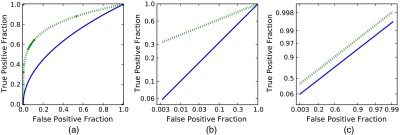
Fig. 1.

Each of the graphs shows the same two power-law receiver operating characteristic (ROC) curves plotted on three different scales. The solid ROC curve has , and the dotted ROC curve has . The scale in (a) is uniform in probability and demonstrates the characteristic asymmetric or skewed power curve . FPF, false positive fractions; TPF, true positive fractions. Graph (b) has a logarithmic probability scale, and here is the inverse of the slope of the ROC curves. Graph (c) has a double negative logarithmic scale and is the offset of the ROC curves.
