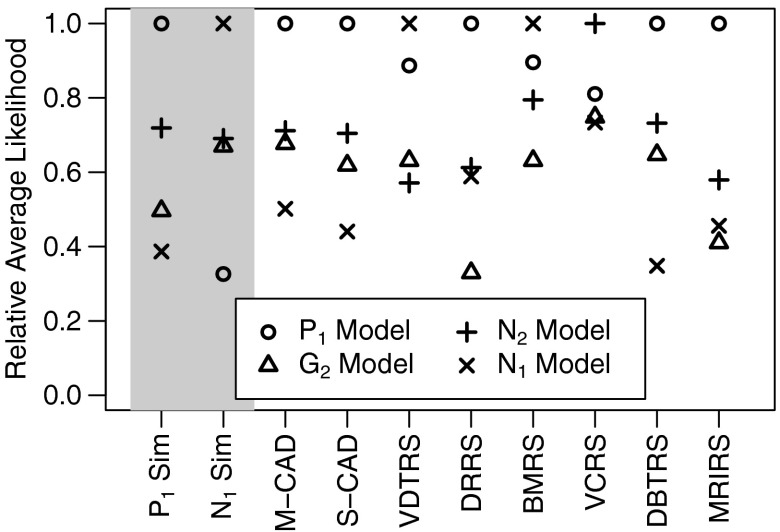
Fig. 3.
This figure plots the relative average likelihood of each of the four models on the 1/3 of the data held-out during cross-validation for each study in this paper. The average likelihoods of all models are divided by the likelihood of the model with the highest likelihood for that study, i.e., the likelihoods are normalized, so the model with the highest likelihood is scaled to 1. The shaded studies on the left are the simulated data sets provided for reference.

