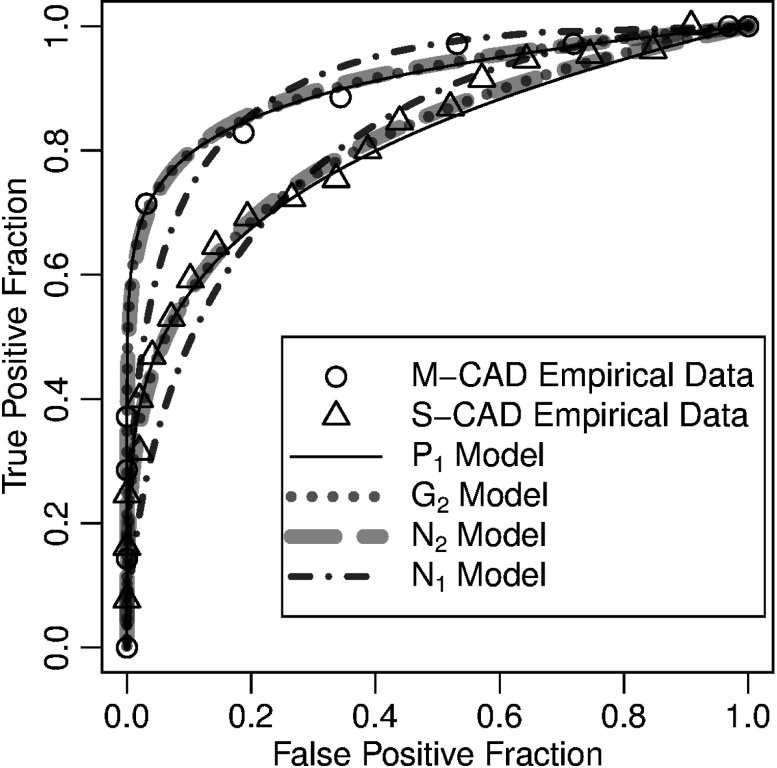
Fig. 4.
: ROC curves of the two computer-aided diagnostic (CAD) observers described in Sec. 4.8. The upper curves are from the mammography CAD. The lower curves are from the spinal CAD. The open circles and triangles are the categorized empirical ROC data. All other curves are semiparametric fits to those empirical data as described in the legend. Note that the power-law model and the two-parameter models are very similar for both CADs, and both data sets depart substantially from the single-parameter normal model.

