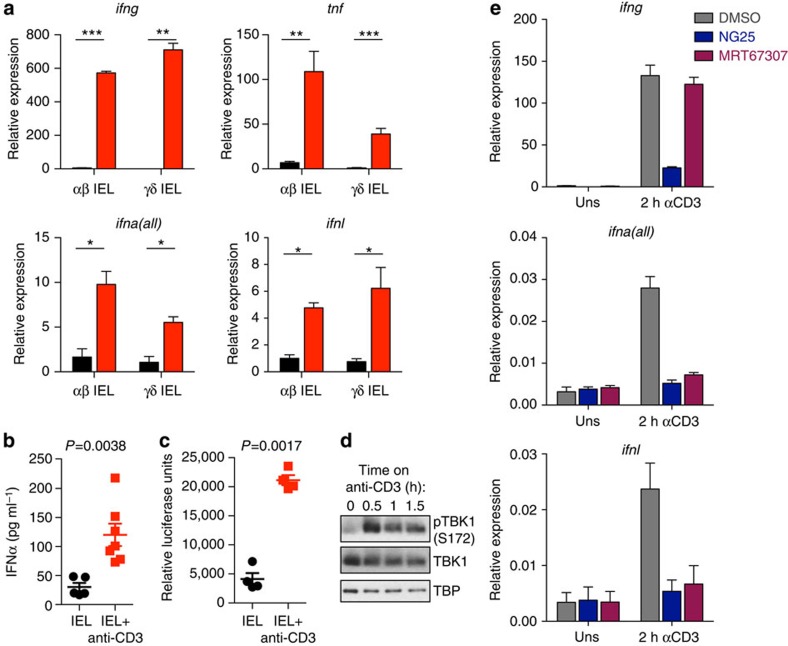
Figure 2. IEL produce type I and III IFN upon stimulation through activation of TBK1.
(a) qRT–PCR showing expression of type I, II, III IFN mRNA and TNF mRNA in IEL sorted into TCRγδ+ CD8αα+ and TCRαβ+ CD8αα+ subsets, cultured and then stimulated with anti-CD3 for 2 h (red bars). Data are the mean and s.e.m. of IEL from three mice. (b) IFNα was measured in resting and activated (18 h) IEL (cultured) supernatant by ELISA. Each point represents an independent culture, n=7. (c) IEL supernatant was assayed for the presence of active IFN by ISRE-luciferase reporter assay, n=4. Statistical significance was calculated in a–c by two-tailed unpaired t-tests, *P<0.05, **P<0.01, ***P<0.001. (d) Cultured γδTCR+ IEL were stimulated on plate-bound anti-CD3. The cells were then lysed and analysed by western blotting for phosphorylation of TBK1 (S172), total TBK1 and the loading control TBP (full blots are shown in Supplementary Fig. 2d). Data are representative of four independent cultures. (e) IEL were pre-treated with 1 μM of each of the following inhibitors for 1 h (NG-25 (TAK1 inhibitor) and MRT67307 (TBK1/IKKɛ inhibitor)), before stimulation on anti-CD3 for 2 h. mRNA for IFNα, IFNλ and IFNγ were measured by qRT–PCR (Uns=unstimulated). Mean and s.e.m. of four technical replicates are shown, and the data represent two independent experiments. DMSO, dimethylsulphoxide.

