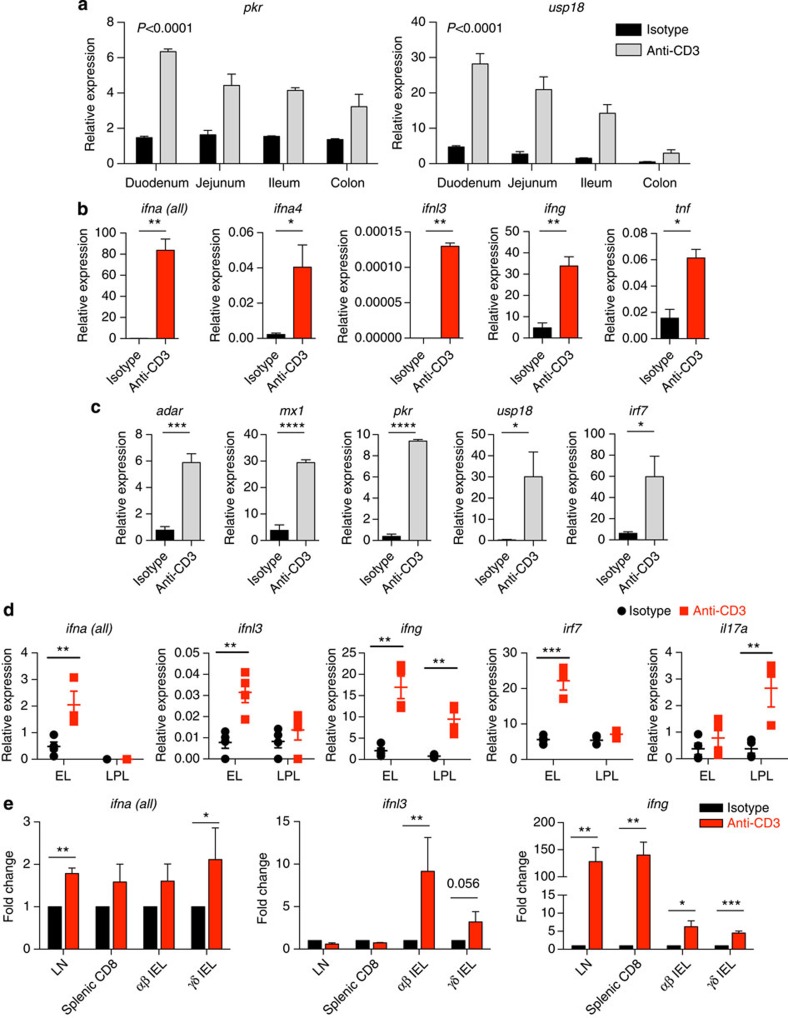
Figure 4. Upregulation of ISGs occurs rapidly in vivo upon T cell activation in the intestine.
(a) WT mice were injected i.p. with control IgG (isotype) or 50 μg of anti-CD3. The intestines were harvested 3 h post injection, and cDNA prepared from small sections of the indicated regions: qRT–PCR was used to measure the upregulation of ISGs as before. Error bars indicate s.e.m. of three mice per condition. Shown are the P values for anti-CD3 to isotype comparison, calculated by two-way analysis of variance. (b,c) The epithelial cell layer was harvested from small intestines of mice treated as in a and then sorted on a MACS column for CD45-positive (mainly IEL (b)) and CD45-negative (mainly intestinal epithelial cells (c)) fractions: qRT–PCR was performed as before. Expression is shown relative to TBP expression. Mean and s.e.m. of n=3 and the data shown are representative of four independent experiments. (d) Mice (n=4) were injected i.p. with 25 μg anti-CD3 antibody or isotype, and after 3 h, the epithelial layer (EL) and LP layer (LPL) were extracted, and analysed by qRT–PCR as in b. (e) Mice were injected i.p. with 25 μg anti-CD3 antibody or isotype, and after 3 h the inguinal lymph nodes (LNs), spleen and IEL were isolated. TCRγδ+ CD8αα+ and TCRαβ+ CD8αα+ IEL were flow-sorted, and analysed by qRT–PCR, alongside sorted CD8+ cells from spleens and total LN cells. Normalized fold change from four experiments is shown. Statistical significance was determined by either unpaired t-tests (b,c,e) or using the Holm-Sidak method (d). *P<0.05, **P<0.01, ***P<0.001. Flow cytometry of sorted cells and histology sections are in Supplementary Fig. 4.

